Network Monitoring is a very important part of Networking, it can alert you of problems before they come to be major issues, it can alert you as soon as a problem occurs and helps you pinpoint the issue as long as you have your network monitoring configured properly. If you have a device that goes down and every device behind that goes down and you have over 50 alarms, it’s going to take you a lot longer troubleshooting the issue than having 1 alarm that will tell where the problem is and where to start troubleshooting.
Just a little background from my personal experience working in a NOCC with network monitoring for an ISP with 100s of locations and over 1000s of network devices, it was more than just network devices that we were saw alerts for. We would get alerts if a door opened, temperature alarms, power alarms, backup generator alarms, even if the fuel was running low in one of the fuel tanks for the generators, we would see a low fuel alarm come up. This gives you an example of the visibility you can have in to your network.
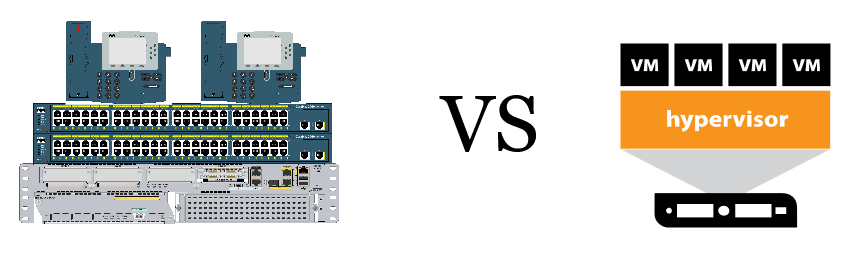
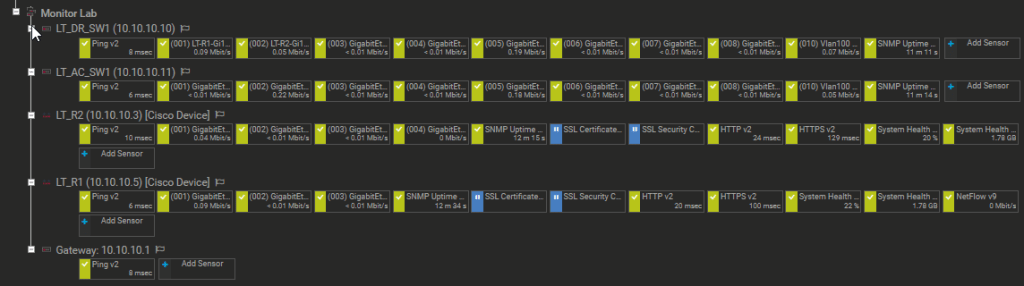
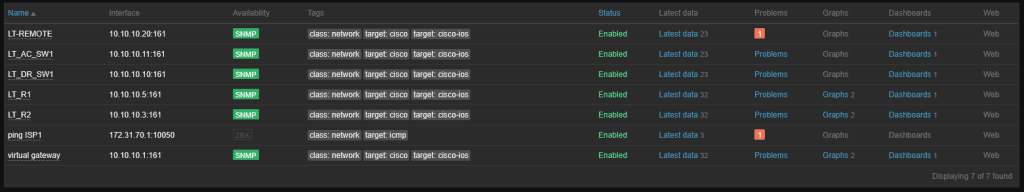
There is a large variety of different tools that do network monitoring such as SolarWinds, PRTG, and Zabbix, there are also other platforms that have their own built-in monitoring such as SD-WAN & Cisco Catalyst Center. For my own home lab, I use both PRTG and Zabbix however PRTG only allows 100 sensors for free and those can be taken up fast depending on what you’re monitoring. I’ll do a breakdown comparing PRTG vs Zabbix in another post.
The many technologies for network monitoring in my experience are SNMP, Netflow, Syslog and Cisco’s IP SLA. Each has their own purpose.
SNMP
SNMP – Simple Network Management Protocol – is one of the main protocols/technologies when it comes to network monitoring. It can be used to monitor routers, switches, firewalls, servers, and printers. SNMP operates with 3 major components. The SNMP Manager or NMS (Network manager software), SNMP Agent the software that runs on the network device, and the MIB (Management Information Base) which is a structured database of objects that can be queried via SNMP. Each object is identified by an OID (Object Identifier). There are 2 different versions of SNMP.
There are 2 different versions of SNMP. SNMP Version 2 and SNMP Version 3.
SNMPv2 sends messages in clear text over the network. SNMPV3 offers Authentication and Encryption on messages sent over the network.
SNMP uses GET and SET. It uses GET requests to pull information off the device such as hostname, system up time and other information and SET request to modify or change the configuration, such as change the hostname or even shutdown an interface, this only works if the write command is configured for the SNMP community string or account if SNMP version 3 is used. Most cases SNMP is set to read only.
Traps & informs are pushed from the agent (router, switch) to the NMS (Network manager software) when a notification happens such as an interface going down
SNMP uses 2 standard ports for sending information to the NMS agent receives requests on Port 161, and the manager receives notifications on Port 162
Netflow
Netflow – is a protocol that was developed by Cisco but has been adapted by other networking companies I think Juniper has their own version called J-Flow. Netflow does Traffic & Bandwidth Monitoring helps with troubleshooting by seeing which user/application are consuming bandwidth it also provides Security & Anomaly Detection by Identifies abnormal traffic patterns such as unusual large data transfers and spikes in network traffic.
Netflow is made up of 3 parts
Exporter: This is a router or switch that collects packets in to flows and sends data records.
Collector: This is the server that receives the data from the exported flow data.
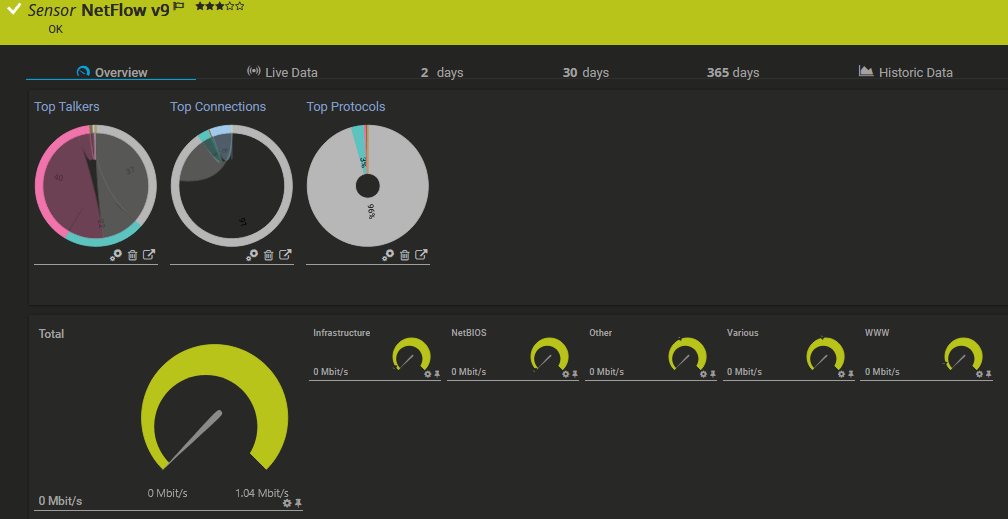
Analyzer: Is the software that collects the data and makes it into a clear view for the network team to view all network activities. PRTG easy to setup build in analyzer.
Netflow collects the following key information
- Source and destination IP
- Source and destination Ports
- Layer 3 protocol types
- Type of services
- Input / output interfaces.
Using NetFlow summarizing traffic into flows provides a deep visibility into how networks are used without the overhead of packet capture or spend time configuring port mirroring and with packet capturing having to filter through the PCAP file if you’re on a large-scale network with a lot of traffic.
Syslog
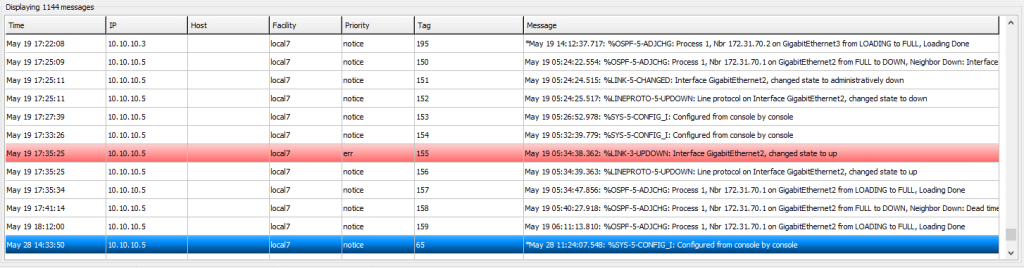
syslog – is a protocol is used to collect system event log messages and having a syslog server to have all your log events from network devices and servers in stored in one location allows for troubleshooting issues and running audits on your network to also see any issues before they cause major problems such as a link getting congested or a CPU or RAM that is running high, which also could be sent via SNMP. Syslog server is important because some network devices such as some cisco devices store their log files in RAM and when the devices is rebooted the log files are erased making troubleshooting an issue more difficult. you’re able to pick what type of messages gets sent to the sys log server such between the Severity Level scale of 0 (Emergency) to 7 (debug).
Cisco IP SLA
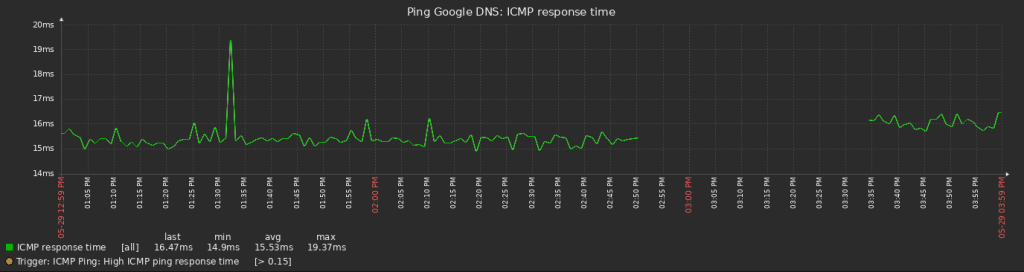
Cisco IP SLA can be used to monitor network performance and track connectivity over the network. IP SLA allows monitor network performance in real time, instead of passive monitoring that the other protocols I’ve mentioned. IP SLA generates its own traffic to measure metrics such as latency, jitter, packet loss, and availability. Juniper has their own version of IP SLA called Real-time performance monitoring (RPM) I have not touched that with my few years working with Juniper hardware but that would be a good idea to spin it up in a lab one of these days.
IP SLAs can be configured on devices such as router or switches to send test data to a destination end point. This data can be used to simulate real network traffic such as ICMP response time, UDP, TCP, HTHTP, DNS and VOIP streams, which makes it very helpful with troubleshooting jitter on voice and video.
There are also other issues of IP SLA in the cisco can be used for such as monitoring a link and switching over to a back up link if it notices the primary link error threshold or jitter threshold are not met and switch over to a back up link.
Running a tier with SNMP, Netflow and syslog in network monitoring system is a great way to have overall visibility of your entire network and to have the most accurate network monitoring allowing you to quickly identify and troubleshoot your network problems and even flag them before they become a bigger issue down the road. There are other ways of network monitoring and other software, I’ve going from what I’ve seen and what I’ve used myself while working in networking. I do plan to do a post on each of these technologies and break them down one by one and show how they can be configured and show some examples of them running on my home lab.