My last post I went over SNMP (check it out) this post I’m going to put these 2 topics together instead of breaking them up. I’ll go over NetFlow first and syslog second.
NetFlow
The way NetFlow was explained to me was saying it’s like your bank account statement for your network traffic. Such as What you spend money on, where it came from, when it happened how much was transferred and the type of transaction. With NetFlow you can it will router identify information from the following:
- Source IP
- Destination IP
- Source port
- Destination port
- IP protocol
- Number of packers
- Number of bytes
- Input interface
- Output interface
- Timestamps
An example of a flow would be the Source IP – Destination IP – Source port – Destination Port – Protocol
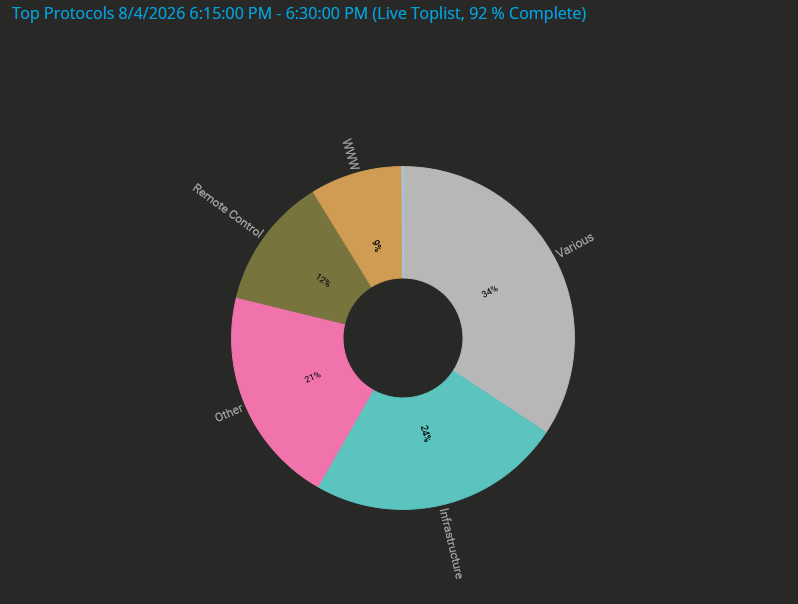
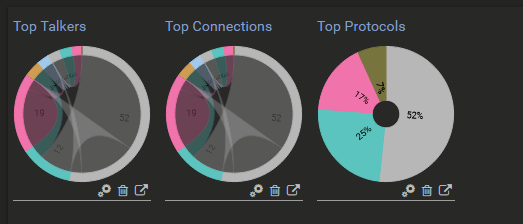
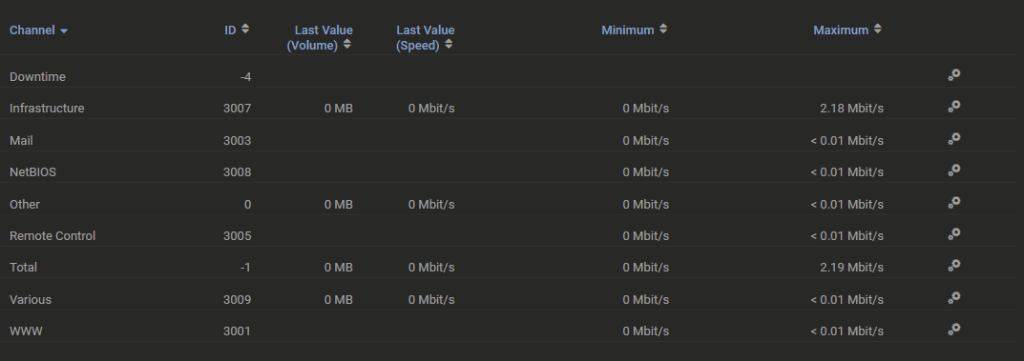
Having access to see flows like this is if you’re hearing that the network is slow you can look at the flow and see this IP address is sending a lot of traffic to this IP address using port 445 than you know someone is doing a large file transfer, or if you are seeing a large amount of 443 traffic you can tell someone is using a lot of internet traffic and go about your troubleshooting, you can also use this information to setup security alerts based on amount of traffic and port numbers, such as a server is generating large amount s of outbound traffic that normally doesn’t, unexpected connections to a unusual number of external IP addresses. It’s very help to see your top talkers, applications, protocols and endpoint devices that are consuming bandwidth.
NetFlow versions
There are 9 versions of NetFlow, I’m not going to cover all of them. Cisco is the company that developed NetFlow that started with version 1, Version 5 was mostly used for legacy devices and now version 9 is the most widely used allowing other companies that use NetFlow or their own version of NetFlow, such as juniper has their JFlow, Fortinet uses NetFlow v9 which has to be configured via CLI.
Components of NetFlow
3 components make up NetFlow such as your Flow Exporter, Flow Collector and Flow Analyzer:
Flow Exporter: This would be a Network device such as a Cisco router or Cisco Switch that is running IOS, IOS-XE or NX-OS. The Exporter inspects the packets creates and updates the flow record in catch and experts them using UDP using port numbers 2055 or 9996.
Flow Collector: This is a server/software application that receives, stores and processes the flow data. Collectors can handle data if multiple exporters send the same flows and manage high volumes of Data. These applications are software such as SolarWinds, PRTG. Myself in my home lab I have PRTG setup on my network monitoring lab. Flow Analyzers: The application such as SolarWinds or PRTG that takes the collected data and makes it readable for reports, alerts and creates easy to ready visualization.
Configuring NetFlow on Cisco
This is the my network topology for my monitoring lab
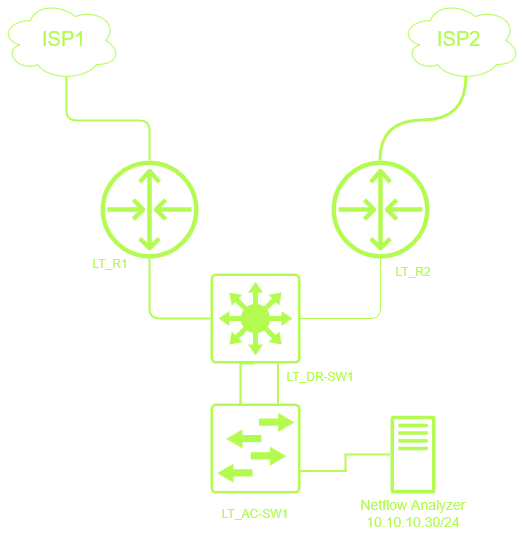
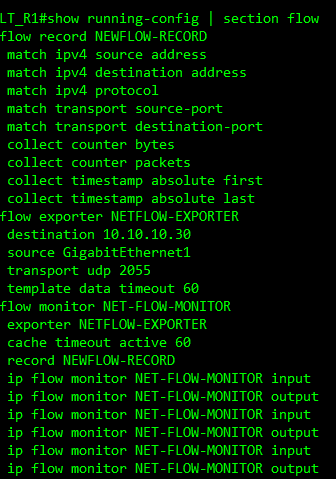
This is the configuration I have setup on my Monitoring lab
LT-R1(config)#flow record NEWFLOW-RECORD
LT-R1(config-flow-record)# match ipv4 source address
LT-R1(config-flow-record)# match ipv4 destination address
LT-R1(config-flow-record)# match ipv4 protocol
LT-R1(config-flow-record)# match transport source-port
LT-R1(config-flow-record)# match transport destination-port
LT-R1(config-flow-record)# collect counter bytes
LT-R1(config-flow-record)# collect counter packets
LT-R1(config-flow-record)# collect timestamp absolute first
LT-R1(config-flow-record)# collect timestamp absolute last
This first sent of commands is creating a flow record and telling what I want to match and collect as you can see we are doing IP source/destination protocol, source & destination port, the number of bytes and packets and the time stamps.
LT-R1(config)#flow exporter NETFLOW-EXPORTER
LT-R1(config-flow-exporter)#destination 10.10.10.30
LT-R1(config-flow-exporter)#source gi0/0
LT-R1(config-flow-exporter)#transport udp 2055
LT-R1(config-flow-exporter)#template data timeout 60
These commands configure the NetFlow Exporter traffic to the Flow Collector / Flow Network analyzer at the IP address of 10.10.10.30 using port 2055 and it’s going to send it every 60 seconds
LT-R1(config)#flow monitor NET-FLOW-MONITOR
LT-R1(config-flow-monitor)# exporter NETFLOW-EXPORTER
LT-R1(config-flow-monitor)# cache timeout active 60
LT-R1(config-flow-monitor)# record NEWFLOW-RECORD
This creates the NetFlow monitor and ties everything together it defines what data is collected via the flow record and where it is going to be sent from the NetFlow Exporter and if the flow is a still active the router will exporter the flow record every 60 seconds.
LT-R1(config)#int gi0/0-1
LT-R1(config-if-range)# ip flow monitor NET-FLOW-MONITOR input
LT-R1(config-if-range)# ip flow monitor NET-FLOW-MONITOR output
LT-R1(config)#int gi0/1
LT-R1(config-if-range)# ip flow monitor NET-FLOW-MONITOR input
LT-R1(config-if-range)# ip flow monitor NET-FLOW-MONITOR output
The last commands are used to apply the monitoring to the interfaces.
Troubleshooting NetFlow
Use the following commands to help troubleshoot NetFlow
show flow exporter – lets you verify things such as exporter name, destination IP, source interface, protocol, port number. Etc.
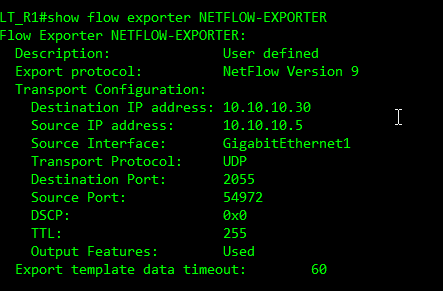
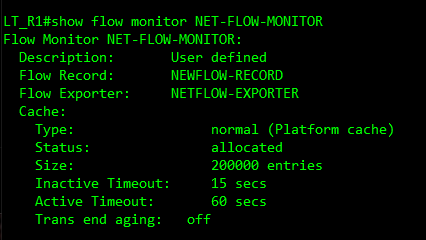
show flow monitor NET-FLOW-MONITOR – Monitor exists, Record being used, Exporter, cache configuration and flow stats.
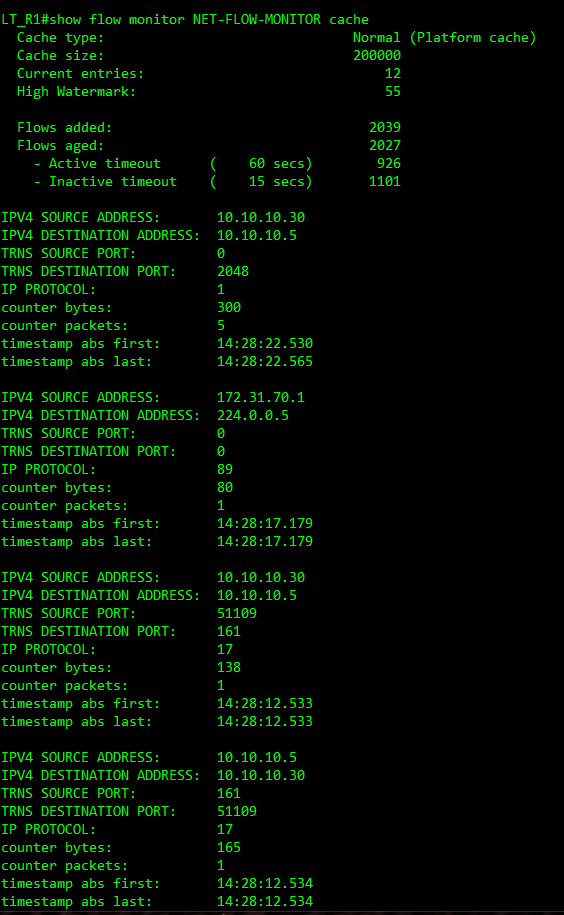
show flow monitor NET-FLOW-MONITOR cache – shows the flows that the router is currently tracking.
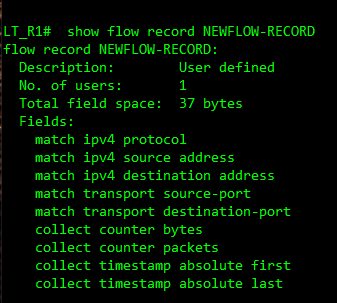
show flow record NEWFLOW-RECORD – shows the flow record defines what information Cisco collects.show running-config | section flow – Check the configuration of NetFlow in your running configuration.
show running-config | section flow – Check the configuration of NetFlow in your running configuration.
Syslog
Syslog is a centralized storage system for all devices that have logs from all devices. When there is an issue on the network and you need to log at the log files or if your normal morning task is to check to see if anything happened on the network overnight, instead of logging in to each device one at a time and looking thought all the logs on all your devices could take all day. Having everything sent to one server where you can view all the logs in one place is very helpful and especially when some devices like Cisco has their log files deleted on a reboot.
Syslog uses port 514 both with UDP and TCP. You can setup a secure version of syslog by sending system messages over TLS but I’m going to show you the basic way for syslog on a Cisco device again this is something you can secure with ACLs and not normally traffic that leaves the network. In real world you want to make this secure.
For my home Lab, I just run Visual Syslog Server on the same server I run PRTG, but having a syslog, netflow and SNMP all in one application is very nice to have on something like SolarWinds, I haven’t spend a lot of time turning up a syslog server with PRTG that might be something I might look in to down the road.
Configure Syslog on Cisco devices.
LT_R1(config)#logging host 10.10.10.30
This sends all logs to 10.10.30.
You can also dig into setup up the configuration to send only certain logs to the syslog server.
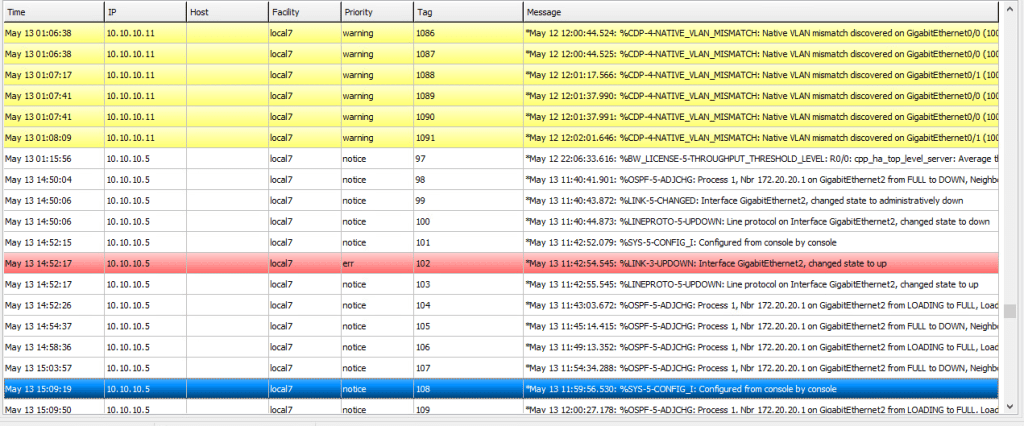
Examples where I’ve had syslogs come in handy for is when seeing who made changes to a router config last, finding a Native VLAN mismatch, and normally just a normal task in the morning to see if anything has happened on the network over night or over the weekend or after a major network change.
Here’s an example of a screen shot from my sys log server.
Conclusion
Conclusion Having these 3 protocols of SNMP, NetFlow and Syslog is a great hybrid network monitoring model and allowing your network monitoring to be accurate and being able to reduce a lot of noise and pinpoint the problem happening on the network is key. Let me know if you have any questions, thoughts or topics you’d like to see me go over.


Leave a Reply